

Rising Global Bond Yields and the UK Fiscal Squeeze
Executive summary
A synchronised global bond sell-off has lifted the UK 10-year gilt yield to 5.41% and the 30-year to 5.89%, the highest levels since 2008 and 1998 respectively, one month before the Autumn Budget on 28 October 2026. The UK did not start this move, but it is more exposed to it than almost any other large advanced economy.
The sell-off is global. The US 10-year Treasury yield stands at 5.22%, its highest since July 2007, and the 30-year touched 5.44% on 24 September. Japan's 10-year yield has passed 3% for the first time since 1996. German, French and Italian yields are at their highest since 2008 to 2011. The common drivers are an energy price shock linked to the US-Iran conflict, a renewed inflation scare, central banks turning back towards rate rises, heavy government borrowing and competition for capital from AI and data-centre issuers.
For the UK, the consequences run through five channels:
• Households: average two-year and five-year fixed mortgage rates have risen to around 5.6% to 5.7% as swap rates follow gilts, while inflation of 3.1% is projected to exceed 4% in early 2027.
• Corporate borrowing: investment-grade companies now face all-in sterling borrowing costs of roughly 6% to 7%, and weaker credits considerably more.
• Business investment: a 1.7% rise in Q2 2026 is at risk as hurdle rates rise and the outlook for demand weakens.
• Public finances: borrowing is £8.1bn above the OBR's forecast for April to August, and debt interest in August was the highest for that month since 1997.
• Fiscal headroom: market estimates suggest that more than half of the £23.6bn buffer against the fiscal rules has been lost, leaving roughly £10bn to £14bn.
The central judgement of this paper is that Chancellor John Healey's room to choose is now narrow. Restoring a credible buffer requires tax rises, spending restraint, or both. Loosening the fiscal rules would risk a further rise in the risk premium the market already charges the UK. How the Budget balances those options, and whether the OBR's forecast window captures the peak of the sell-off, will shape borrowing costs for households, firms and the Exchequer well into 2027.
This paper builds on a news article on the gilt sell-off ahead of the Budget, including comments by Nigel Green of deVere Group, and extends it with market, central bank and official data current to 28 September 2026.
The global picture: a synchronised sell-off
Every major government bond market has sold off over the past year, and September 2026 brought the sharpest leg of the move. Long-dated yields in the US, UK and Japan are at multi-decade highs, and the rise has been broad enough that no major market has offered a safe haven.
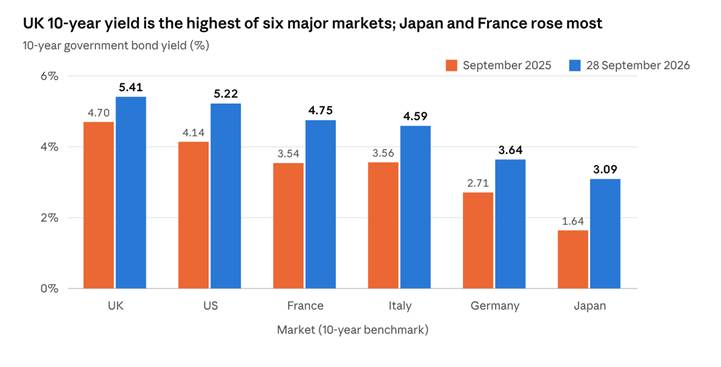
Trading Economics · 10-year yields on 28 September 2026; year-ago levels derived from reported annual change
The UK carries the highest 10-year yield of the six, although its rise over the year (0.71 percentage points) has been smaller than elsewhere. That distinction matters: the UK entered the sell-off from an already elevated base, so it now faces the highest absolute cost of borrowing among the large advanced economies.
Market | Milestone | Central bank stance | Local pressure point |
United Kingdom | 10-year highest since 2008; 30-year at 5.89%, highest since 1998 | Bank Rate held at 3.75% on 17 September by 6 votes to 3; three members voted to raise to 4% | Thin fiscal headroom, sticky inflation, large index-linked debt stock |
United States | 10-year highest since July 2007; 30-year reached 5.44% on 24 September, highest since 2004 | Federal Reserve raised its target range to 3.75% to 4.00% in September; further rise priced for October | Federal debt of about $40tn; heavy Treasury and AI-related corporate issuance |
Japan | 10-year above 3% for the first time since 1996; 30-year at 4.17% | Bank of Japan policy rate 1.25%, with a further rise discussed for October | End of the ultra-low anchor for global fixed income |
Germany | 10-year at 3.64%, highest since June 2009 | ECB policy rate 2.65%; around 100 basis points of rises priced by late 2027 | Defence and infrastructure spending; energy costs |
France | 10-year at 4.75%, highest since 2008 | As for the euro area | Deficit forecast of 5.4% of GDP in 2026 and a fragmented parliament before the 2027 election |
Italy | 10-year at 4.59%, about 95 basis points over Bunds | As for the euro area | High debt stock and sensitivity to euro area spreads |
Two features stand out. First, the move is led by long maturities: investors are demanding more compensation to hold 30-year paper, which points to rising term premia rather than simply higher expected policy rates. Second, Japan has changed role. For two decades, near-zero Japanese yields pushed domestic savings into US, European and UK bonds. With the 10-year JGB above 3%, that capital now has a reason to stay at home. As TD Securities' Prashant Newnaha put it, "JGBs were the anchor for global fixed income for a long time. Now it has flipped."
Why yields are rising: six reinforcing drivers
The sell-off is not the product of a single shock. Six forces are working in the same direction, and several of them are structural rather than cyclical, which is why markets doubt that yields will fall back quickly.
1. An energy price shock. Direct US-Iran exchanges and the wider Middle East conflict have pushed Brent crude to about $106 a barrel. The Bank of England reports that Brent is up 36% and UK wholesale gas up 78% since its July Monetary Policy Report. Energy feeds directly into headline inflation and, through wages and prices, into expectations.
2. A renewed inflation scare. UK CPI rose to 3.1% in August, with services inflation at 3.4%. The Bank now projects inflation of about 3¾% by the end of 2026 and slightly above 4% in early 2027. In the US, business surveys point to rapidly rising input prices alongside strong activity.
3. Central banks turning back towards tightening. The Federal Reserve raised rates in September. Markets price a better-than-even chance of a further US rise in October, more than an 80% chance of a Bank of England rise on 5 November, and around 100 basis points of ECB tightening by late 2027. The Bank of Japan may raise again in October.
4. Heavy government borrowing. Large deficits in the US, France and the UK mean a steady supply of new bonds that investors must absorb. Where fiscal plans lack credibility, investors demand a higher term premium to hold long-dated debt.
5. Competition for capital. Technology companies are issuing large volumes of bonds to fund AI and data-centre build-outs, competing with governments for the same pool of fixed-income investment.
6. The loss of Japan as a global anchor. With domestic yields above 3%, Japanese pension funds and insurers have less reason to buy foreign bonds, removing a long-standing source of demand for Treasuries, Bunds and gilts.
The critical distinction for the UK is that yields are rising for the wrong reasons. When yields rise because growth is strong, the currency usually strengthens and tax receipts rise. When they rise because of inflation and fiscal concern, sterling tends to weaken and the public finances deteriorate. In early September, sterling slipped towards $1.35 even as gilt yields reached their highs, which is the pattern of a market pricing risk rather than rewarding strength.
Why the gilt market is more exposed
The UK is a price-taker in a global sell-off, but several features of its debt and its investor base amplify the effect. Since July 2024, the 10-year gilt yield has risen by roughly 1.3 percentage points.
• A large index-linked stock. Roughly a quarter of gilts are linked to RPI inflation, a far higher share than in other G7 countries. When inflation rises, the cost of this debt rises immediately, regardless of market yields. An energy-driven inflation spike therefore hits the UK Exchequer twice: once through higher conventional yields and once through indexation.
• Fading structural demand for long gilts. Defined benefit pension schemes were for decades the natural buyers of 30-year and 50-year gilts. Many are now in surplus and moving to insurer buyouts, reducing their appetite for the longest maturities just as supply remains high. This is a key reason why the 30-year yield has risen further than the 10-year.
• Quantitative tightening. The Bank of England continues to reduce its gilt holdings, including through active sales. Even at a reduced pace, this adds to the net supply the private market must absorb.
• Reliance on overseas investors. Around a third of conventional gilts are held overseas. These investors can move quickly, and their demand depends on confidence in both the fiscal outlook and sterling.
• A credibility premium. Since the 2022 mini-budget, markets have attached a premium to UK fiscal risk. A change of Prime Minister and Chancellor in July 2026, with John Healey succeeding Rachel Reeves, has kept attention on whether the fiscal framework will hold.
There is one important mitigating factor. The UK's debt has a long average maturity, among the longest in the G7, so higher yields feed through to the interest bill gradually as existing debt is refinanced rather than all at once. As WPI Strategy's Martin Beck notes, "the higher yields gradually feed through into a larger debt-interest bill as existing debt is refinanced." The damage is therefore slower than a headline yield move suggests, but it is also persistent and hard to reverse.
Effects on the UK public
Households feel a gilt sell-off first through mortgages, and then through prices, pensions and public services. Bank Rate has not moved since December 2025, yet the cost of new fixed-rate borrowing has risen sharply.
Mortgages
Fixed-rate mortgages are priced off swap rates, which track gilt yields, not off Bank Rate. Over roughly a month to early September, the two-year swap rose from 4.06% to 4.26% and the five-year from 4.16% to 4.36%. Moneyfacts data put the average two-year fix at 5.63% and the average five-year fix at 5.68% on 7 September, with rates edging closer to 6%. HSBC, Barclays, NatWest and Santander all raised selected fixed rates in early September, and at least one building society temporarily withdrew its fixed-rate range.
The payment shock for those refinancing depends on when they last fixed. The illustration below uses a £200,000 repayment mortgage over 25 years.
Borrower | Previous rate | Previous monthly payment | Monthly payment at 5.65% | Increase per year |
Five-year fix taken in 2021 | 1.5% | £800 | £1,246 | about £5,350 |
Two-year fix taken in 2024 | 4.5% | £1,112 | £1,246 | about £1,600 |
The group most exposed is borrowers now leaving five-year fixes arranged in the low-rate period of 2021. The housing market is already cooling: mortgage approvals fell to 56,100 in July, the lowest since January 2024.
Renters, savers and pensioners
• Renters. Higher mortgage costs for landlords, particularly those on buy-to-let products, tend to pass through into rents with a lag.
• Savers. Savings and fixed-term bond rates will improve, and those with cash buffers gain. The gain is eroded, however, if inflation moves above 4% as projected.
• Retirees buying annuities. Annuity rates are priced off long gilt yields and are among the most attractive in decades. This is one of the few clear winners from the sell-off.
• Defined contribution savers. Bond funds held in pensions and ISAs have fallen in value as yields have risen, which particularly affects those in "lifestyled" funds approaching retirement.
Taxes and public services
The wider cost to the public comes through the Budget. Every pound spent on debt interest is a pound unavailable for public services. With the fiscal buffer eroded, households face a high probability of further tax rises in October, as RSM UK's Thomas Pugh has argued. As deVere's Nigel Green put it in the source article, "When the central bank and the bond market tighten the screws together, households feel it first."
Corporate borrowing
Gilt yields are the floor on which all sterling credit is priced, so a rise in the government's cost of borrowing lifts the cost for every company. With the 10-year gilt near 5.4%, even high-quality investment-grade companies must pay around 6% to 7% to issue sterling bonds, once a credit spread is added.
The impact differs by type of borrower:
Borrower type | How the sell-off reaches them | Likely effect |
Large investment-grade companies | New bond issues priced off gilts or Treasuries plus a credit spread | Higher coupons; some issuers delay, shorten maturities or borrow in other currencies |
High-yield and leveraged companies | Wider spreads on top of a higher base; private credit repricing | Refinancing risk for debt issued at low rates in 2020 and 2021; covenant pressure |
Private equity-owned businesses | Floating-rate loans and refinancing of acquisition debt | Lower valuations, fewer exits, pressure on interest cover |
Small and medium-sized enterprises | Bank lending rates track swap rates and Bank Rate expectations | Tighter credit, higher cost of asset finance and working capital |
Commercial property | Valuations move inversely with long gilt yields | Falling capital values and loan-to-value covenant stress |
Three risks deserve particular attention.
The refinancing wall. A large volume of corporate debt was issued at very low rates in 2020 and 2021. As that debt matures in 2026 and 2027, companies must refinance at coupons that may be double or triple their existing rates. For businesses with thin margins, the step-up in interest costs can turn a viable company into a distressed one.
Crowding out. Governments and technology companies are both issuing heavily. Where investors can earn more than 5% on a UK government bond, riskier corporate borrowers must offer materially more to attract capital.
Smaller firms. Survey evidence already shows a divergence: in August, larger manufacturers continued to grow, while smaller manufacturers recorded falling output and new orders. SMEs rely more on bank credit and have less access to capital markets, so they bear rising financing costs with fewer alternatives. Insolvency levels remain elevated.
Business investment
Business investment rose 1.7% in Q2 2026 and stood 0.8% above a year earlier, a modest recovery that the sell-off now puts at risk. Revised figures are due from the ONS on 30 September.
Higher yields weigh on investment through three routes.
1. Higher hurdle rates. Companies assess projects against their cost of capital, which is anchored on long-term gilt yields. A one percentage point rise in the discount rate cuts the present value of a project with 20 years of level cash flows by about 7%. Projects that cleared the bar in early 2026 may no longer do so, especially long-horizon investments in infrastructure, energy transition and property.
2. Weaker demand. Households paying more on mortgages and facing higher taxes spend less, which reduces the expected return on new capacity. The British Chambers of Commerce expects the economy to contract by 0.2% in Q3 and grow only 0.1% in Q4, with growth of about 1% for 2026 as a whole.
3. Uncertainty. Until the Budget is delivered, firms do not know whether they face higher employer taxes, changes to capital allowances or new sector levies. Many will defer decisions until after 28 October.
The sectors most exposed are those with long payback periods or high leverage: housebuilding and commercial property, utilities and renewable energy developers, infrastructure, and capital-intensive manufacturing. Technology and defence may prove more resilient, supported respectively by AI-related demand and higher government spending.
The longer-term concern is productivity. The UK has had persistently low business investment relative to its G7 peers for more than a decade. A prolonged period of 5% to 6% long-term rates would make that gap harder to close, weakening the growth on which the public finances ultimately depend.
Debt interest and the public finances
Debt interest is now one of the largest lines of public spending, and it is the line most directly driven by the bond market. According to the OBR, debt interest rose from £39bn (1.7% of GDP) in 2019-20 to £106bn (3.6% of GDP) in 2024-25, and it remains above £100bn a year on a debt stock of about £3tn.
The latest data show the pressure building:
Measure | Outturn | Comparison |
Public sector net borrowing, August 2026 | £18.3bn | OBR forecast £14.8bn; City consensus £15.6bn |
Borrowing, April to August 2026 | £77.3bn | £8.1bn above the OBR forecast |
Debt interest, August 2026 | £8.8bn | Highest August figure since 1997 |
Public sector net debt | 93.8% of GDP | Broadly stable |
The sensitivity of the interest bill to yields is the crux of the Budget problem. The source article cites an estimate that each quarter-point rise in gilt yields adds about £2.5bn a year to interest costs once it feeds through, or roughly £10bn for a full percentage point. On top of this, higher RPI inflation raises the cost of index-linked gilts directly.
A note on the £200bn figure. The source article quotes an estimate that around £200bn a year goes to lenders. That figure is well above the OBR's official measure of central government debt interest, which is a little over £100bn. The difference is likely to reflect a broader or gross definition. For Budget analysis, the OBR measure is the appropriate benchmark, and it is still large enough to exceed the combined budgets of several major departments.
The central point is not the size of the bill alone but its direction. Because the UK's debt has a long average maturity, each year more low-coupon debt matures and is replaced at today's higher yields. Even if yields stabilised now, the interest bill would keep rising for several years.
The OBR and the vanishing headroom
The £23.6bn of headroom the OBR measured in March 2026 has been roughly halved by higher yields, and almost all of the deterioration comes from higher interest costs. This matters because headroom is the margin by which the government is forecast to meet its fiscal rules, and a thin margin leaves the plans exposed to the next market move.
The fiscal rules
The government's binding rule is the stability rule: the current budget (day-to-day spending against revenue) must be in balance by 2029-30. A second rule, the investment rule, requires public sector net financial liabilities to be falling as a share of GDP in the same year. Headroom is measured against these targets in the OBR's forecast, so any increase in forecast debt interest reduces it pound for pound.
How much headroom remains
Source | Estimate |
OBR, March 2026 Economic and fiscal outlook | £23.6bn against the stability rule |
Bloomberg Economics | About £12bn of the buffer removed by higher yields |
Deutsche Bank (Sanjay Raja) | Headroom reduced to about £13.8bn |
Panmure Liberum | About £6bn lost from longer-dated yields alone |
Market consensus reported in late September | Headroom of roughly £10bn to £14bn |
Why the reference window matters
The OBR does not use the yield on Budget day. It takes the average of market gilt yields over a short reference window several weeks before the Budget, and uses the implied path of rates in its interest forecast. The March 2026 forecast used the window from 10 to 22 January, when the 10-year yield was assumed at 4.5%. The 10-year yield now stands at 5.41%, around 0.9 percentage points higher.
The window for the October forecast has not been publicly announced, but it will fall in the coming weeks. If the sell-off persists through that window, the higher yields will be locked into the official baseline, however markets move afterwards. This is the "trap" Nigel Green describes: "A thin buffer practically invites the bond market to test it."
Other forecast changes will also affect headroom, in both directions. Higher inflation boosts nominal tax receipts, which partly offsets higher interest costs, while any downgrade to the OBR's productivity or growth assumptions would widen the gap further. The £8.1bn overshoot in borrowing to August suggests that, so far, the adverse factors are dominating.
The 28 October Budget and the fiscal squeeze
The Chancellor's first Budget must restore a credible buffer against the fiscal rules at a time when every available lever carries an economic or political cost. John Healey has placed fiscal discipline at the core of the Budget, and the Chief Secretary to the Treasury, Emma Reynolds, has said that "we must always know where the money is coming from to pay for public services."
The size of the task
If headroom has fallen to around £10bn to £14bn, the Chancellor faces a choice between accepting a thin buffer or rebuilding it. The Resolution Foundation's James Smith has warned that "the chancellor cannot afford to squeak through the budget with reduced headroom." Restoring headroom to its March level would require measures worth roughly £10bn to £15bn a year by 2029-30, before any new spending commitments, such as on defence, are funded.
The options
Option | What it involves | Main advantage | Main risk |
Tax rises | Extending threshold freezes, property or wealth-related taxes, broadening the base of existing taxes | Credible with markets if durable; raises revenue quickly | Weighs on consumption and investment; politically difficult after earlier tax rises |
Spending restraint | Tighter departmental settlements, welfare reform, efficiency targets | Signals discipline without higher taxes | Pressure on already stretched public services; implementation risk |
Loosening the fiscal rules | Changing the target year, debt measure or treatment of investment | Creates room without immediate tax rises | High risk of a further rise in the UK risk premium, which could cost more than it saves |
Changing debt management | Issuing more short-dated debt and fewer long gilts | Reduces pressure at the weakest part of the curve | Increases exposure to future rises in Bank Rate |
Deferring decisions | A "focused" Budget that parks major choices until 2027 | Avoids immediate economic drag | Markets may read delay as a lack of credibility |
Most commentators expect a combination of the first two. RSM UK's Thomas Pugh has said that "another round of tax rises in October now looks inevitable."
The market reaction risk
The Budget will be judged in real time by the gilt market. The UK has direct recent experience of this: the September 2022 mini-budget showed how quickly unfunded commitments can trigger a disorderly rise in yields. The lesson for October is that credibility has a measurable price. A package that rebuilds headroom through durable, clearly costed measures would reduce the risk premium and, over time, the interest bill. A package that relies on optimistic assumptions or rule changes could add to it.
The monetary policy interaction
The Budget also interacts with the Bank of England's decision on 5 November, a week later. A tight fiscal stance would weigh on demand and may ease the pressure for a rate rise. Tax rises that add to prices, such as higher indirect taxes, could do the reverse by lifting inflation in the short term. The Chancellor and the Monetary Policy Committee will each be reacting to the other.
Scenarios and indicators to watch
The outlook depends mainly on energy prices, central bank decisions and the credibility of the Budget. The three scenarios below are illustrative. Their headroom effects use the rule of thumb of roughly £10bn a year per percentage point change in yields once fully fed through.
Scenario | What drives it | 10-year gilt range | Implication for headroom | Implication for households and firms |
Relief | Progress in US-Iran talks, oil falls back below $90, Budget rebuilds headroom convincingly | 4.9% to 5.1% | Some of the lost headroom recovered; less pressure for further tightening | Fixed mortgage rates ease back towards 5%; corporate issuance reopens |
Central | Energy prices stay high, one further Bank Rate rise, Budget broadly credible | 5.25% to 5.5% | Headroom rebuilt only through tax rises and restraint | Mortgage rates around 5.5% to 6%; investment subdued into 2027 |
Stress | Oil spikes further, global sell-off extends, Budget seen as lacking credibility | 5.75% to 6% or higher | Headroom exhausted; pressure for a further fiscal event in 2027 | Mortgage rates above 6%; refinancing strain for leveraged firms; weaker growth |
The signals that will show which path is unfolding:
• Energy prices: Brent crude and UK wholesale gas, the main inflation driver.
• The 30-year gilt yield: the clearest measure of the UK-specific term premium.
• The spread between gilts and Treasuries or Bunds: a widening spread would point to UK-specific concern rather than a global move.
• Sterling: a falling pound alongside rising yields signals a credibility problem.
• The OBR reference window: where yields sit during the window determines the official baseline.
• ONS business investment revision: due 30 September.
• September CPI and public finances data: both published in October, before the Budget.
• The Budget: 28 October.
• Bank of England decision: 5 November, with markets pricing a better than 80% chance of a rise.
• Federal Reserve and Bank of Japan decisions: both meet in late October, and both may raise rates.
Conclusion
The global bond sell-off has shifted the balance of power in UK fiscal policy from Westminster towards the bond market. The UK did not cause the move, but its high starting yields, large index-linked debt, weakening pension demand for long gilts and thin fiscal buffer make it one of the most exposed economies.
The effects are already visible: higher mortgage costs for households, borrowing costs of 6% to 7% for sound companies, a recovery in business investment at risk, and an interest bill that will keep rising as debt is refinanced. Roughly half of the Chancellor's £23.6bn headroom has gone before a single Budget decision has been taken.
The Budget on 28 October therefore has one overriding test: whether it convinces investors that the UK's fiscal plans are durable. A credible package will be painful, involving higher taxes, tighter spending, or both. The alternative, a thin buffer or looser rules, risks a higher risk premium that would cost households, firms and the Exchequer more over time. As Nigel Green put it, "There's no cheap way out."
Sources
• Source article: "UK Bond Sell-Off Seizes Control of Treasury Budget Ahead of October Address", including comments by Nigel Green, deVere Group (24 September 2026)
• Bank of England: Monetary Policy Summary and minutes, September 2026
• OBR: Economic and fiscal outlook, March 2026
• ONS: Business investment in the UK, April to June 2026 provisional results
• Trading Economics: UK 10-year gilt yield
• Trading Economics: UK 30-year gilt yield
• Trading Economics: US 10-year Treasury yield
• Trading Economics: Japan 10-year JGB yield
• Trading Economics: Germany 10-year Bund yield
• Trading Economics: France 10-year OAT yield
• Trading Economics: Italy 10-year BTP yield
• Axios: Treasury yields rip higher on renewed inflation fear (24 September 2026)
• BNN Bloomberg: Global bond rout deepens as Japan yield hits key milestone (1 September 2026)
• The Spectator: Surging gilt yields are making Healey's fiscal headroom even tighter
• Options Trading Report: UK gilts near 6%, the bond market is writing the Budget
• Business Matters: UK borrowing hits £18.3bn in August as debt interest costs climb
• Mortgage Affordability: UK mortgage rates update, September 2026 (Moneyfacts data)
• CPA: UK business news, 2 September 2026
• Crowdfund Insider: John Healey to replace Rachel Reeves as Chancellor (20 July 2026)
Important notice
This document is provided for general information and discussion purposes only. It does not constitute investment, financial, legal, tax, accounting or other professional advice, and it is not a recommendation or solicitation to buy, sell or hold any security, financial instrument or other product, or to adopt any particular investment or business strategy. Readers should seek independent professional advice appropriate to their own circumstances before making any decision.
The information and data in this document are drawn from sources believed to be reliable, including official publications, market data providers and media reports, as at the date shown. No representation or warranty, express or implied, is given as to their accuracy, completeness or timeliness, and they have not been independently verified. Market conditions, data and official forecasts can change rapidly, and the document will not necessarily be updated to reflect subsequent developments.
Any scenarios, projections, estimates, illustrative calculations or forward-looking statements are indicative only. They are based on assumptions that may prove incorrect and are not a reliable indicator of future outcomes. Past performance is not a guide to future performance, and the value of investments and the income from them can fall as well as rise.
Views expressed by third parties quoted in this document are their own and do not necessarily reflect the views of the author. The views of the author are those held at the date of publication and are subject to change without notice.
To the fullest extent permitted by law, neither the author nor any associated organisation accepts any liability for any loss or damage, whether direct, indirect or consequential, arising from any use of or reliance on this document or its contents. This document may not be reproduced, distributed or published, in whole or in part, without prior written consent.
September 28th, 2026 · @Eric Williamson